Optimisation of processes is one of the key activities in pharmaceutical R&D. The goal of process optimisation is to reduce the cost of production by saving time and material and to increase the quality of the product. Process optimisation is achieved through trial and error of numerous process runs, since the process performance is conventionally assessed only off-line on the end product. The optimization can be further advanced by the use of in-line measurements of process behaviour. In a pellet coating process, the spray rate is an important process parameter, which directly influences process performance indicators, such as product end-quality, process yield and production time. During pellet coating process development, several coating trials at different spray rates have to be carried out. The total agglomeration of pellets is determined after finishing the process by sieve analysis. By using an in-line visual inspection system, the agglomeration of pellets in dependence of spray rate and product temperature can be observed during the coating process.
In this case study, we varied the spray rate throughout a single pellet coating process. By using in-line agglomeration measurements, we were able to determine the optimal spray rate (fastest process with lowest amount of agglomeration) within a single process run.
The study was performed by Sensum and Shin-Etsu Pharma researchers.
Pellet coating process
We coated 800 g of sugar pellet cores (595 µm – 707 µm) in a lab-scale Wurster fluid-bed coater (Minilab XP, Diosna) in Shin-Etsu’s application laboratory in Wiesbaden. An aqueous coating dispersion was prepared with 7 % methyl cellulose (Metolose® SM-4, Shin-Etsu) and 0.1 % blue colouring agent. The coating dispersion viscosity was 67 mPas. A coating process was started with 8 g/min spray rate. During the process, we increased the spray rate (SR) from the initial 8 g/min to the final 14 g/min in increments of 1 g/min. In this way we tested the SR at 6 levels. The inlet air temperature was constant throughout the coating process in order to achieve a product temperature decrease from 39 °C to 31 °C as a consequence of spray rate increase. The pellets were sifted after the coating process to estimate the final percentage of agglomerates using a 1000 µm sieve.
Process monitoring
We monitored the process with an inline visual inspection system (PATVIS APA, Sensum) (Figure 1). The system acquired images of pellets through the glass wall of the fluidized bed coater and analysed them in realtime. The pellets were monitored in free fall, which allowed the system to detect and measure the presence of agglomerated pellets in the process (Figure 2). Image acquisition rate was performed with high speed at 100 frames per second, providing 100 000 real-time particle measurements per minute on average. The percentage of agglomerated pellets was expressed as a volumetric ratio between all detected agglomerated pellets and all analysed pellets in one minute time intervals.
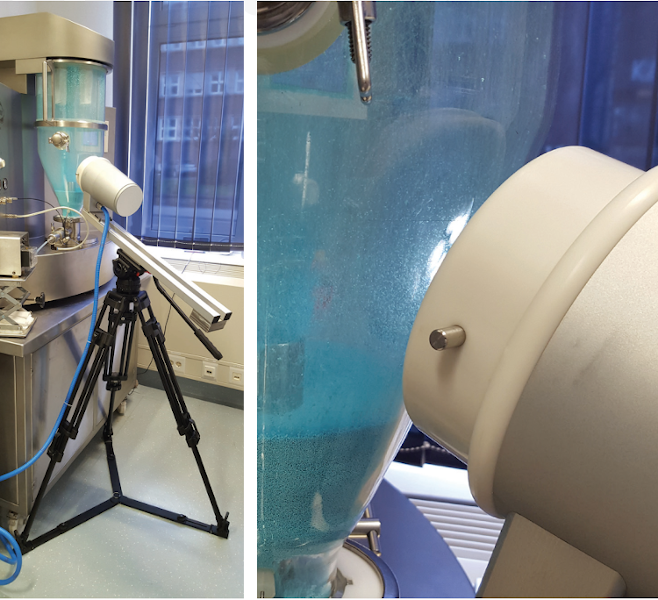
Figure 1: Imaging setup, equipment and materials used for the coating process
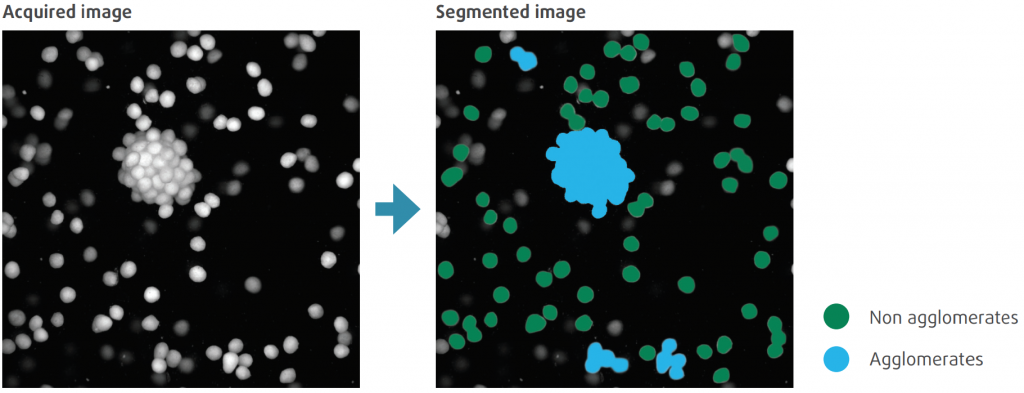
Figure 2: The visual inspection system uses advanced computer vision algorithms to detect single and agglomerated pellets.
Determination of the optimal spray rate
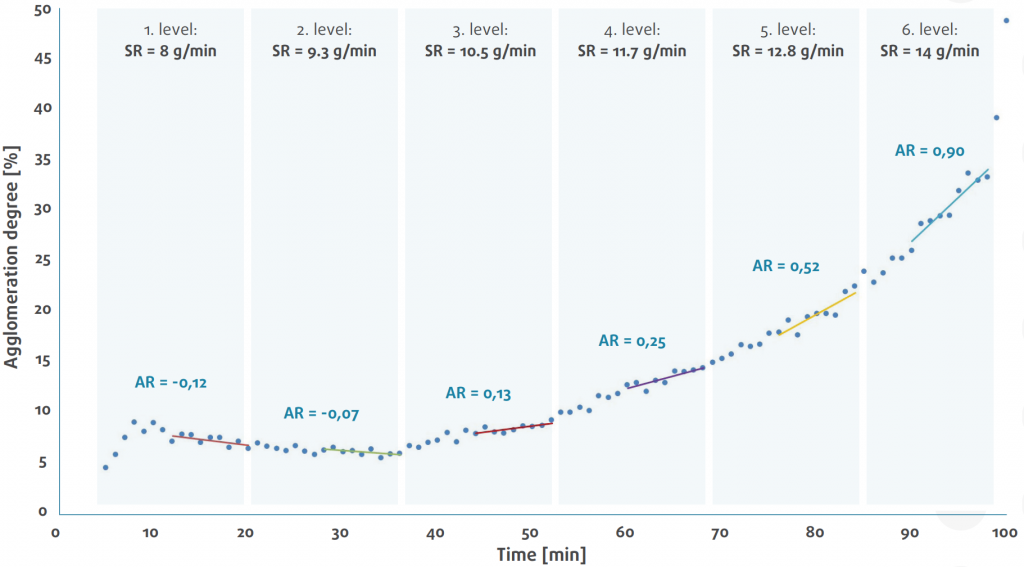
Figure 3: presents an in-line estimation of the percentage of agglomerated pellets during the single coating process, where the spray rate (SR) was tested at 6 levels. At the start of the process, we could observe the formation of soft agglomerates. Soft agglomerates started to break apart after the first 8 minutes of spraying, when the process stabilised. The percentage of agglomerates started to increase exponentially after the third increment. A linear trend line was fitted to each increment to ascertain agglomeration speed or rate (AR). At the end of the process, off-line sieve analysis confirmed a high final percentage of agglomerates at 64.6 %.
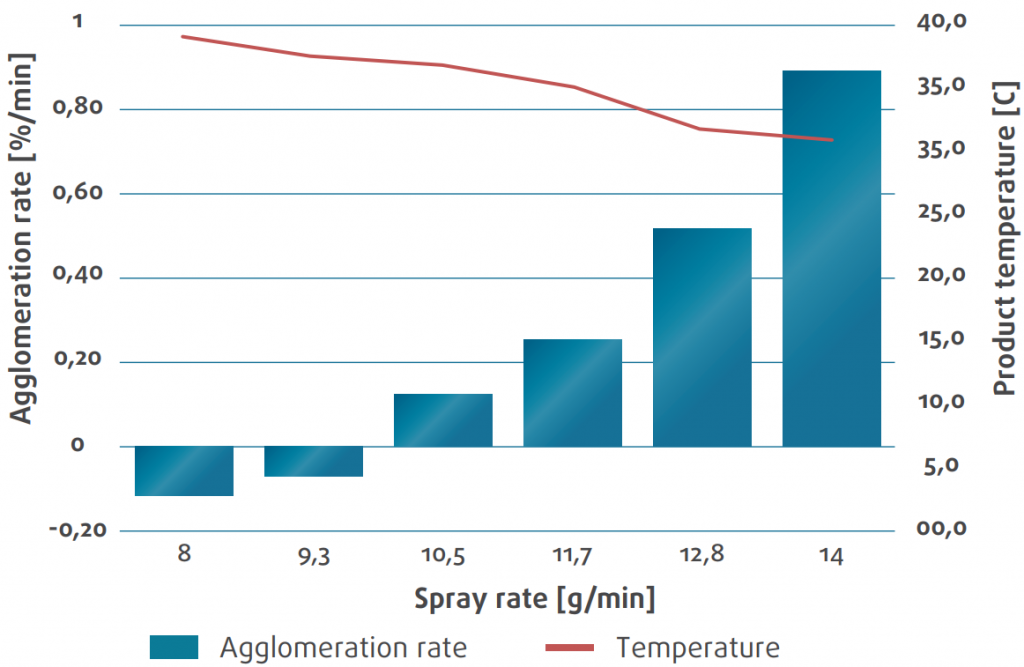
Figure 4: From the slope of the fitted trend lines in Figure 3, we obtained the agglomeration rate (AR) for each SR level. With the increasing spray rate and constant inlet air temperature, the temperature of the product decreased and the percentage of agglomerates increased. We can observe an increase in the rate of agglomeration for every incremental increase of SR. The in-line measurements show us that the process is at its optimum in-between of 9.3 g/min and 10.5 g/min SR, where no new agglomerates are forming. In contrast, the final tested SR at 14 g/min produced almost a percent of new agglomerates every minute.
Conclusions
We used an in-line visual inspection tool (PATVIS APA, Sensum) to monitor a pellet coating process with methyl cellulose (Metolose® SM-4, Shin-Etsu), where the spray rate was incrementally increased throughout the process. The in-line agglomeration measurements provided us immediate feedback of the process performance and gave us an insight and understanding of the spray rate influence on the coating process. With such an effective approach, we were able to determine the optimal spray rate within a single process run. This is a great step towards saving time and costs in pharmaceutical R&D.
Additional information
Find out more about Sensum PATVIS APA here.
Download Sensum PATVIS APA brochure.
Similar posts